Want to predict Fitbit’s quarterly revenue? Eagle Alpha did it using web scraped product data
Throughout the history of the financial markets information has been power. The trader with access to the most accurate information can quickly gain an edge over the market.
Two hundred years ago, in the age before telegrams and news services, knowing the results of battles, elections and campaigns before anybody else was a huge advantage.
Fifty years ago, before Reuters began digitizing company statements, access to company financials gave fundamentals-based investors like Benjamin Graham and Warren Buffett an edge over other investors.
Five years ago, before the creation of dedicated social sentiment data providers, only the largest financial institutions could get access to the sentiments of the crowd.
Today, however, all these data types have become commonplace, easily available and edgeless. Eroding their ability to generate alpha.
To get an informational edge today, hedge funds and other financial institutions are increasingly turning to data providers who can give them alternative sources of data that have yet to be commoditized.
Data providers like Eagle Alpha, who are providing financial institutions with a broad range of alternative datasets, from satellite to consumer transaction data, that can be leveraged to gain an informational edge over the market.
To test the power of alternative data, Eagle Alpha made a bold prediction on July 4th, 2017.
From their analysis of the available traditional datasets combined with pricing data obtained from scraping product data from e-commerce websites, Eagle Alpha predicted that Fitbit was going to exceed the consensus view of their 2017 Q3 revenue. Creating a sizeable opportunity for astute traders to generate alpha from the inherent inefficiency in Fitbit’s stock price.
The result?
Not only did Eagle Alpha’s prediction become reality, their reason for why Fitbit would report higher than expected revenue matched exactly what Fitbit CEO James Park cited as the cause for their unexpected good results.
This is the story of how they did it and how you can do it too...
Fitbit’s Struggles
In early 2017 Fitbit wasn’t doing so well.
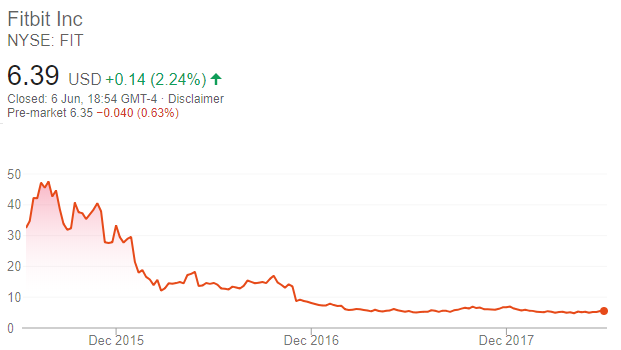
When it went public, Fitbit was the poster boy of the wearables craze sweeping the world. On IPO day (June 17, 2015), Fitbit’s stock price jumped nearly 50% from its public offering price of $20 per share.
Over the next couple of weeks, Fitbit’s stock price continued to rise, riding on the wave of enthusiasm for the booming fitness wearable market.
However, after reaching a peak of $51 per share in August 2015 things have never been the same.
Fitbit’s meteoric success spawned a new breed of competitors all looking to get a slice of this booming business. Leading to fierce competition from fellow startups and major players like Apple, Samsung, and Xiaomi.
All in all, by mid-2017 Fitbit’s stock price had fallen from its highs of $51 per share in August 2015 to $5 per share in July 2017.
At this time investors weren’t expecting much from Fitbit. When major players like Apple entered the market, Fitbit tried to position itself as more than just a fitness tracker, but as a smartwatch as well. Fitbit released competitive products, but Wall Street wasn’t convinced that they were good enough.
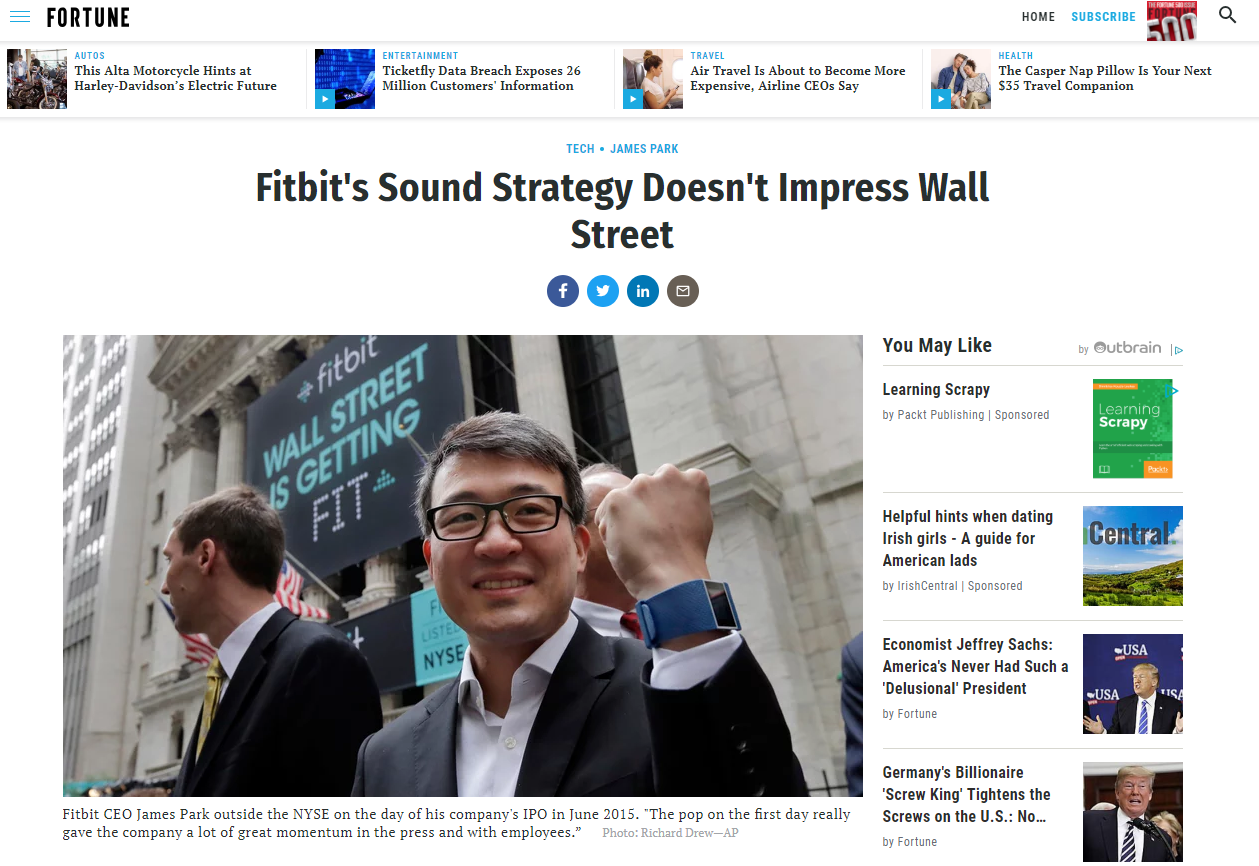
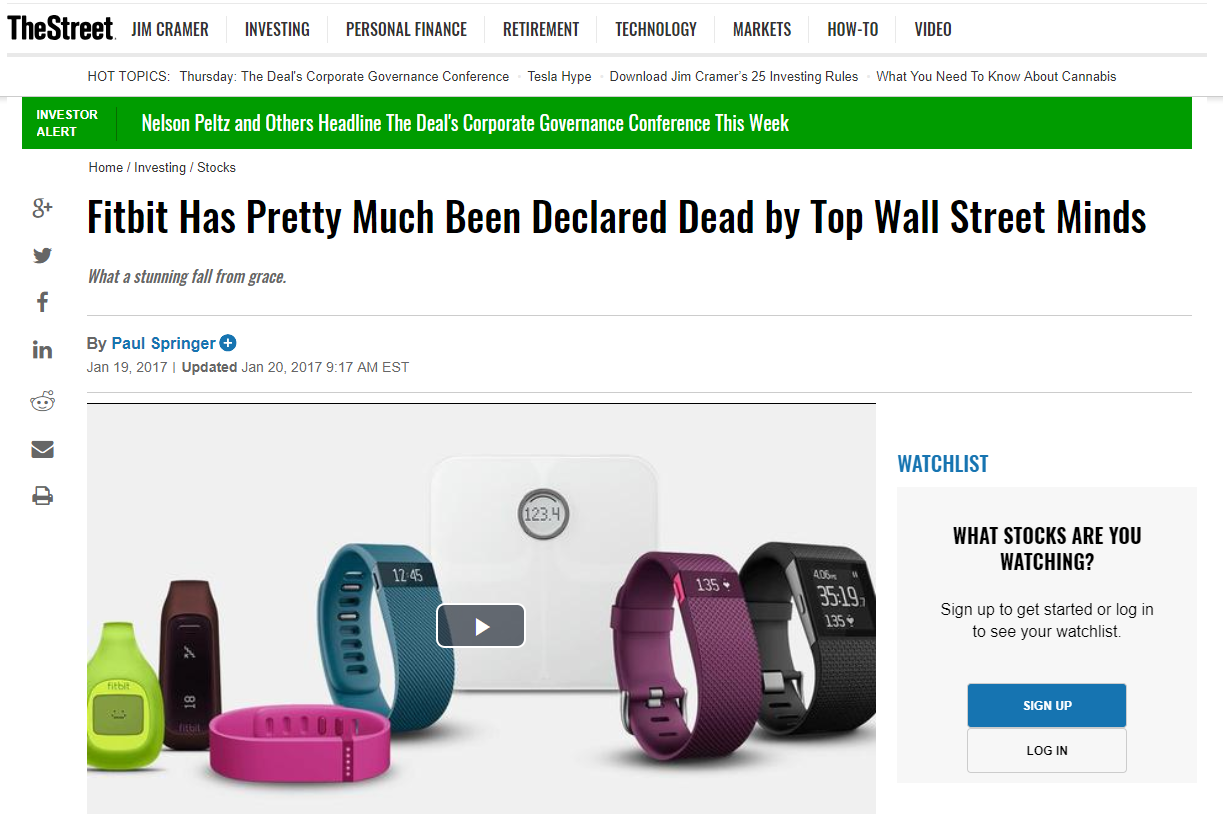
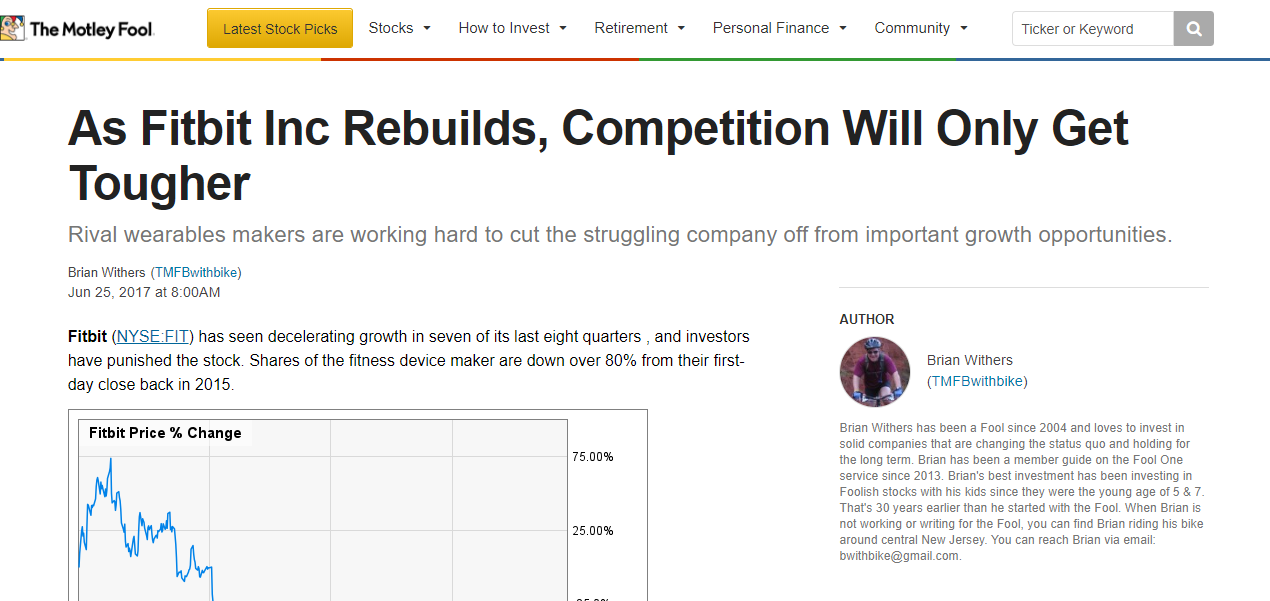
In July 2017, investors expected Fitbit to lose 15 cents per share in Q2 based on the general consensus that Fitbit’s revenue would decline 42%, similar to the 41% decline reported in Q1.
But unbeknownst to many of these investors, Fitbit’s underlying fundamentals were changing. The problem was traditional data sources weren’t able to pick it up, creating an opportunity to generate alpha over the market.
That’s where Eagle Alpha comes in.
Eagle Alpha’s business is in the collection and supply of alternative financial data that can be used by financial institutions to more precisely predict the fundamentals of companies and markets.
They hypothesized that by tracking Fitbit’s product pricing data and percentage share of e-commerce best sellers lists they could better estimate Fitbit’s sell-through trends and as a result their expected revenue for Q2 2017.
To test this hypothesis, they first needed a reliable means of tracking this data. Which they achieved via extracting product and best seller trends data from major e-commerce sites using web scraping.
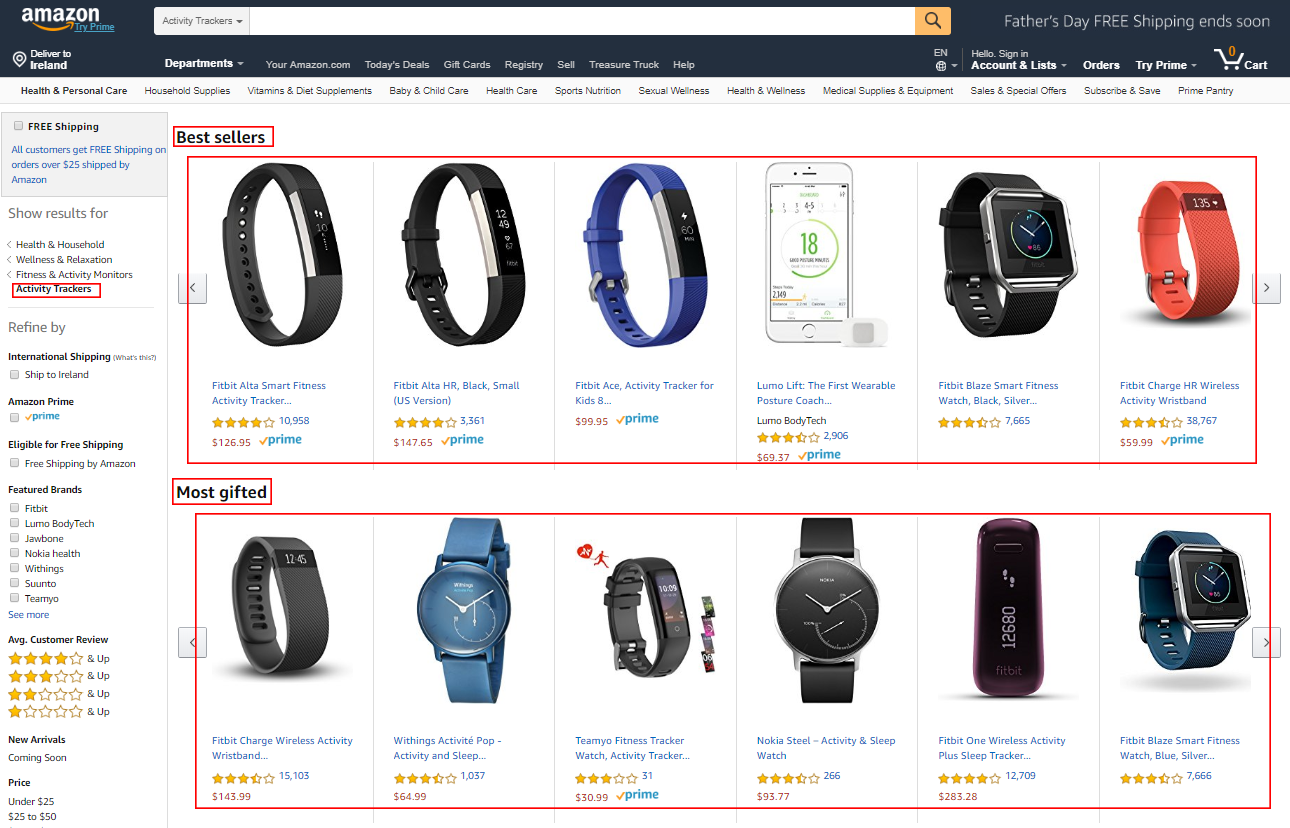 Scraping Best Selling Activity Trackers From Amazon
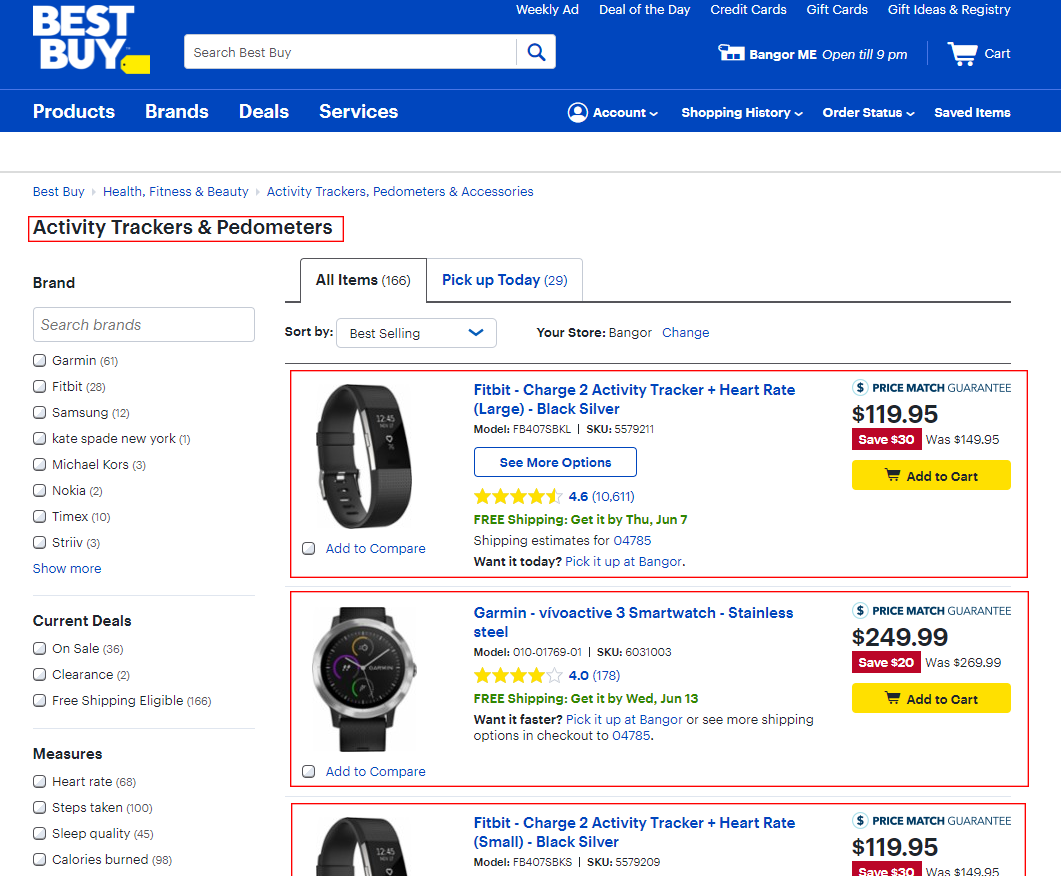 Scraping Top Activity Trackers From Best Buy
Using data obtained from this daily web scraping they were able to gather real-time insights into how the fitness wearables market was performing.
First, by tracking the number of fitness watches being sold on sites like Amazon.com and Bestbuy.com they were able to deduce that the number of fitness wearables was stabilizing at around the 300 mark. Indicating that the recent surge in new competitors was coming to an end.
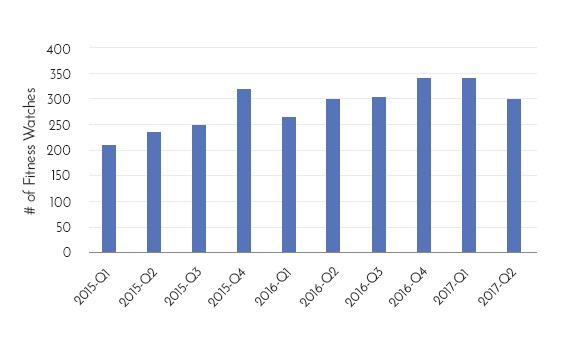 Number of Fitness Watches on Best Buy Store. Source - Eagle Alpha
Next, this e-commerce data indicated that Fitbit was able to maintain the share of the bestsellers list it recovered in Q1 despite the increased competition from Garmin and Samsung.
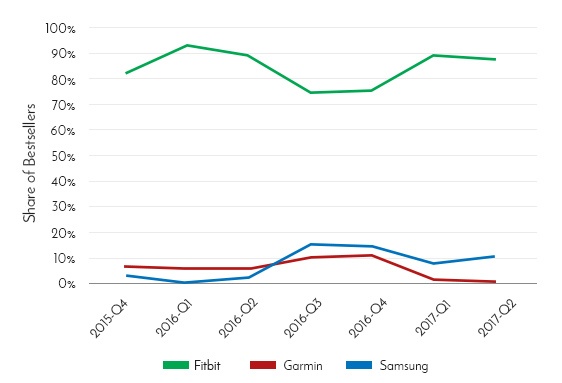 Fitness Wearables Share of Best Sellers. Source: Eagle Alpha
But most importantly, Eagle Alpha’s data indicated that Fitbit maintained this market share without lowering their average sales price (as estimated from pricing data obtained from web scraping).
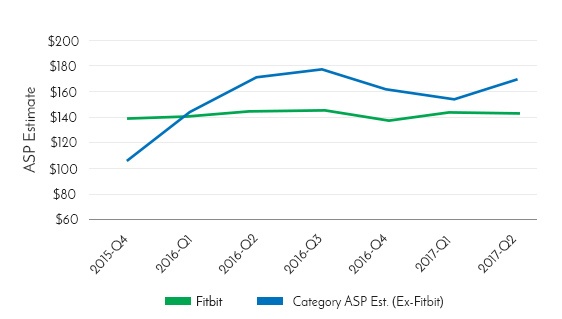 Average Selling Price of Fitness Wearables. Source: Eagle Alpha
When combined with traditional financial data, this web scraped product data appeared to suggest improving sell-through trends for Fitbit products for both Q1 & Q2 of 2017 without any reduction in average sales price.
However, these improving sell-through trends weren’t being reflected in Fitbit’s reported (sell-in) Q1 revenues due to excess inventory in the channel. Something that Eagle Alpha didn’t expect to be the case for Q2.
Fitbit management had commented at their Q1 earnings call that US inventory had declined 30% in Q1, due to the increased sell-through trends experienced in retail. Suggesting that Q2 would have a much cleaner channel.
When all this traditional and alternative data was combined it painted a picture that was contradicting the general consensus of the market.
As mentioned previously, the general consensus was that Fitbit’s revenue would continue to fall in Q2 resulting in a $0.15 per share loss.
Eagle Alpha’s data suggested that US sell-through trends for Fitbit products in Q2 would be similar to those reported in Q1. But given Fitbit’s cleaner inventory channel for Q2, stable sell-through trends should result in stronger reported revenue trends in Q2 than Q1, elevating Fitbit’s share price.
If this hypothesis proved correct, it would be a huge opportunity for traders to gain an edge over the market.
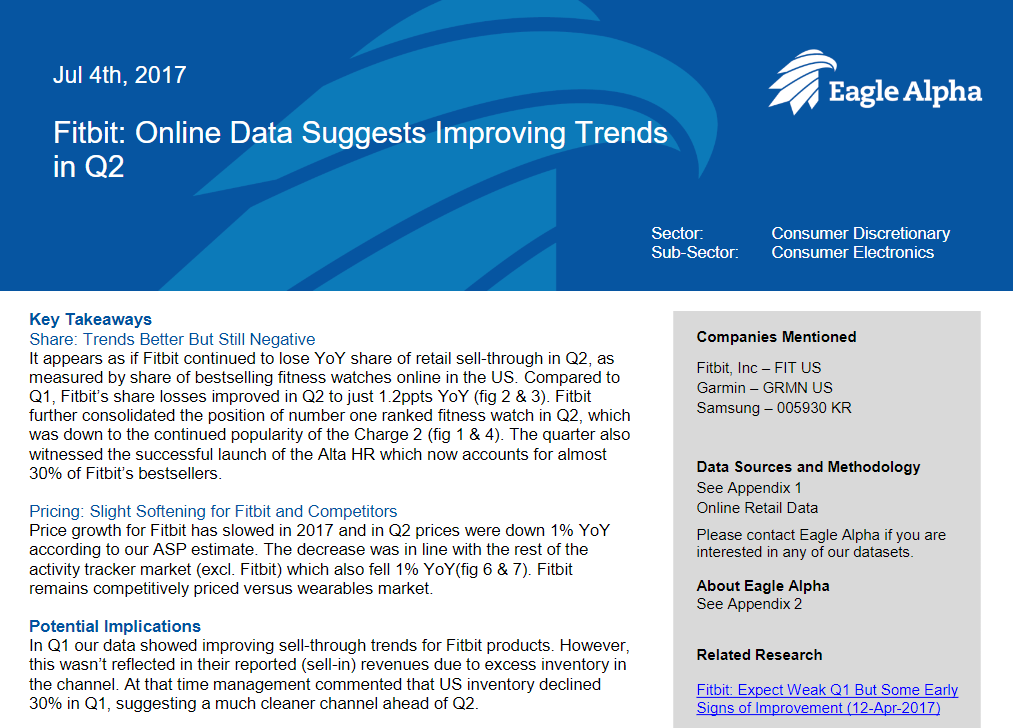
Eagle Alpha was so confident in their analysis that they published their prediction in a research note on July 4th 2017, a month ahead of Fitbit’s Q2 results.
Make or Break Time: Fitbit’s 2017 Q2 Results
On August 2nd 2017, the moment of truth came...
As predicted, Fitbit reported better than expected results with adjusted revenue of $353.3m vs the consensus estimates of $339.2m held by the market. Which resulted in a loss per share of $0.08, nearly half the expected loss of $0.15 per share.
In a statement, co-founder and CEO James Park said "Consumer demand in the second quarter was better than anticipated, enabling Fitbit to reduce channel inventory and generate better sales".
Exactly matching the assessment made by Eagle Alpha a month prior.
Naturally, these better than expected results saw an immediate increase in Fitbit’s stock price. Finishing 15% higher that day ($5.08 to $5.84), and going on to finish 37% higher at $6.98, two months later.
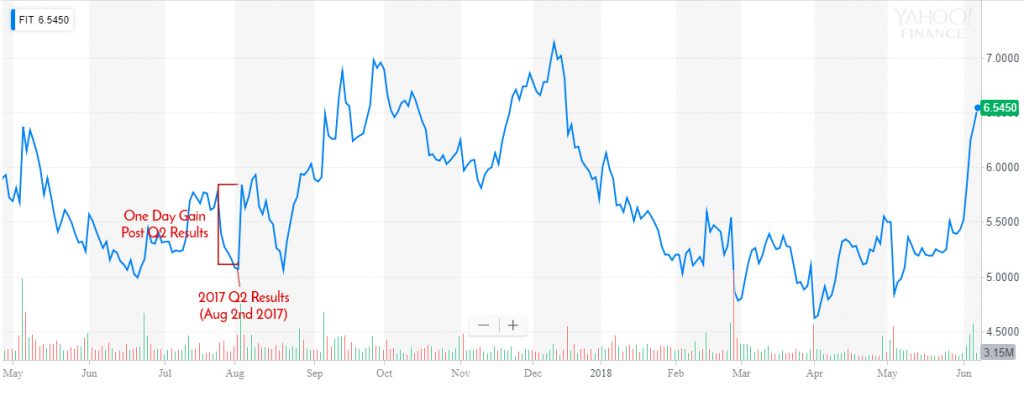
Meaning that those who followed Eagle Alpha’s advice were able to generate significant alpha over the market.
Unfortunately, for Fitbit they weren’t able to maintain these better than expected results for long.
In Q3 2017 Fitbit again beat Wall Street expectations posting a $113 million loss on revenue of $393 million, however, when the company announced in its Q4 2017 report showing that it was losing 2 cents per share on revenue of $571 million it led to a complete reversal on all the gains it had made.
Today, Fitbit’s stock hovers around the $6.50 mark but the jury is still out on whether or not Fitbit can live up to the lofty expectations that everyone had of it at the time of its IPO in June 2015.
What we do know is that financial institutions are increasingly turning to alternative financial data to give them an informational edge over the market.
It is now estimated that 78% of hedge funds are using alternative data to inform their investment decisions, and 32% of those that weren’t using alternative data previously expect to start incorporating it into market analysis efforts this coming year.
At Scrapinghub we specialize in turning unstructured web data into structured data that supports your business processes, be it informing your investment process if you are a hedge fund or enabling your dynamic pricing processes if you are in e-commerce.
If you would like to learn more about how you can use web scraped product data in your business then feel free to contact our sales team, who will talk you through the services we offer startups right through to Fortune 100 companies.
At Scrapinghub we always love to hear what our readers think of our content and any questions you might. So please leave a comment below with what you thought of the article and what you are working on.
